Extend Handler - Metrics
The Extend Override and Events Handler is currently available for Closed Beta partners only. Please submit a ticket if you're interested in applying as a Closed Beta partner.
List of metrics
non-message_type
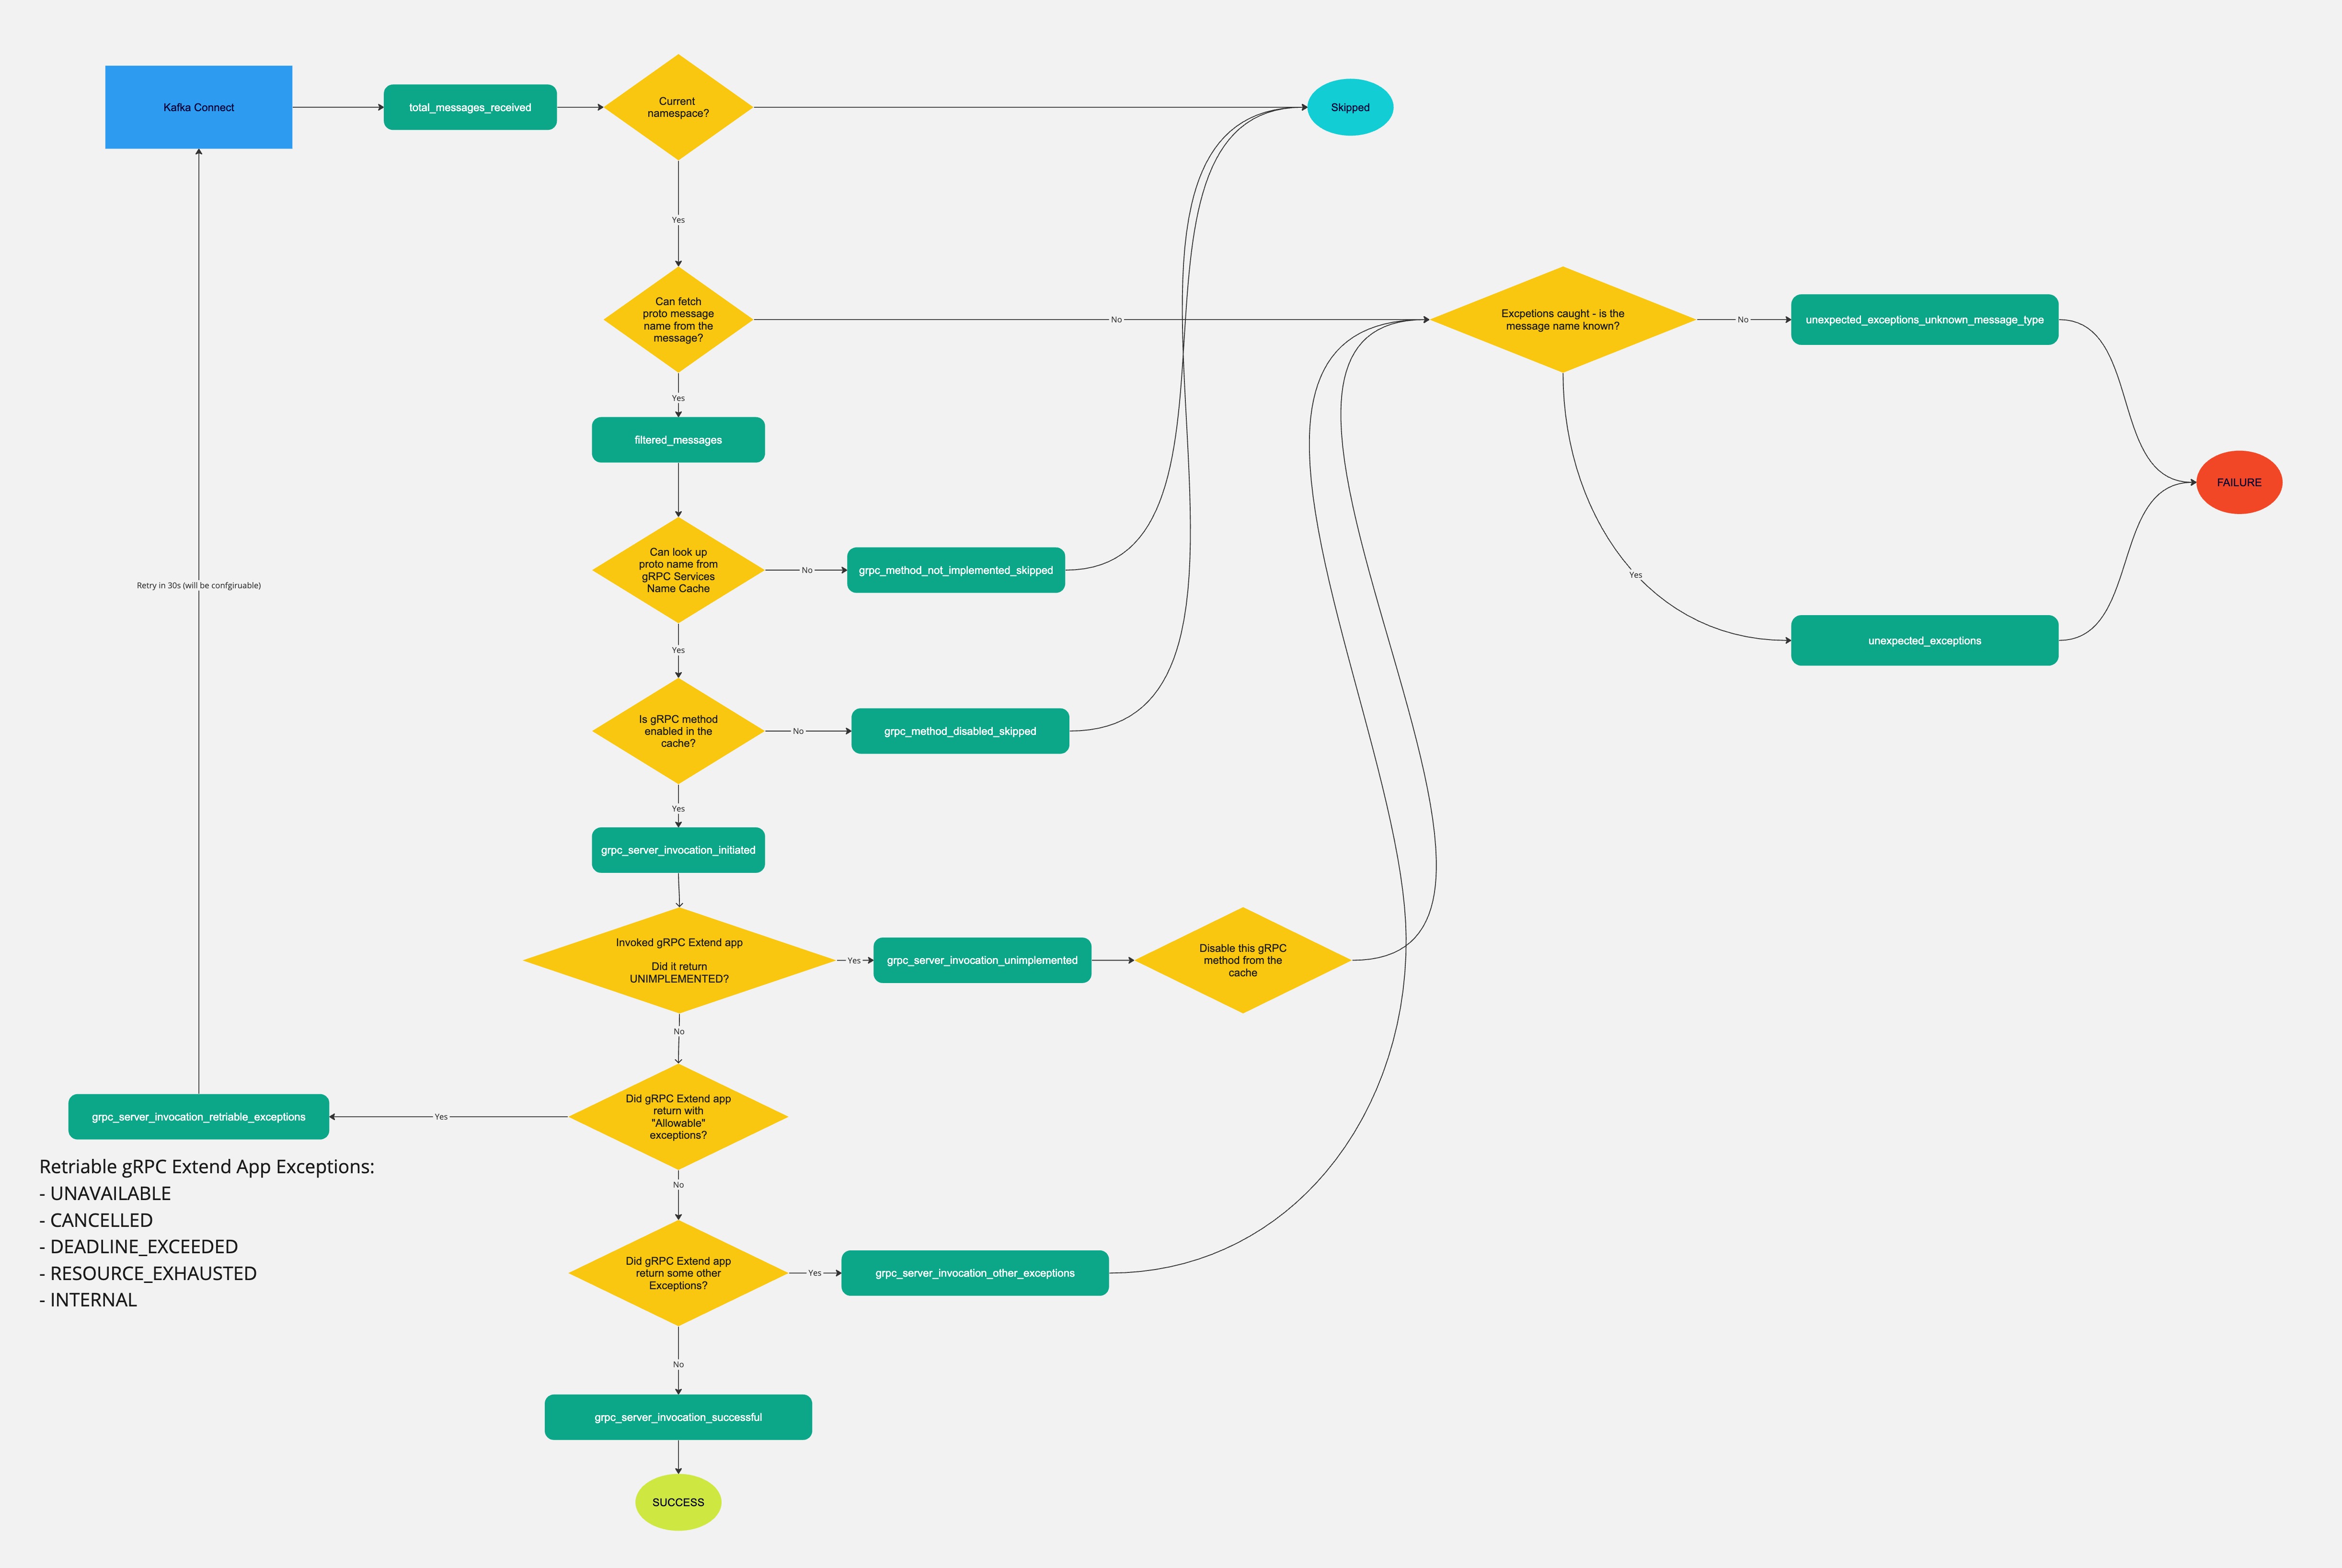
total_messages_received: a top-level metric that is incremented whenever a message is received. When this metric is incremented, the Kafka Sink Connector receives messages coming from Kafka before any further processing takes place.
message_type
filtered_messages: a metric for the number of messages being processed with readable proto message names. The proto message name is used to map which gRPC call to make.grpc_method_not_implemented_skipped: indicates that the gRPC coulddn't be found and therefore a call from the gRPC services name cache couldn't be made. As a result, the gRPC method invocation is skipped. The gRPC services name cache is built when the connector starts up and queries the list of methods by gRPC reflection against the gRPC server. This cache is checked first before any gRPC is invoked.grpc_method_disabled_skipped: indicates that the gRPC services name cache is found via gRPC reflection, but its status is disabled because it had previously been invoked but was IMPLEMENTED from the gRPC server.grpc_server_invocation_unimplementedis also incremented. Seegrpc_server_invocation_unimplementedfor more details. It should not be possible for the gRPC invocation to be skipped because the gRPC server and the connector for the list of implemented methods live in the same pod and therefore should always be in sync.
Flow
After successfully reading and looking up the message name from the mapping files:
rpc_server_invocation_initiatedgets incremented then invokes the gRPC Extend app mapped method.
Upon gRPC server invocation:
grpc_server_invocation_successfulgets incremented when the gRPC Extend app successfully replies back to the Extend app with status codeOK.grpc_server_invocation_unimplementedinvokes the gRPC Extend app but the app responded with UNIMPLEMENTED. This happens because the gRPC services name cache in the connector -- which is a sidecar with the gRPC Extend app -- was built after the gRPC Extend app was fully started.grpc_server_invocation_retriable_exceptionsinvokes the gRPC Extend app but the app responded with allowable exceptions that are deemed to be retriable:List of retriable gRPC Extend App exceptions:
- UNAVAILABLE
- CANCELLED
- DEADLINE_EXCEEDED
- RESOURCE_EXHAUSTED
- INTERNAL
grpc_server_invocation_other_exceptions: gRPC is invoked but the gRPC Extend app replied with other exceptions that are not deemed retriable.
Overall exceptions metrics
unexpected_exceptions_unknown_message_type: indicates that there are non-retriable exceptions that can't distinguish what exact message type (the proto message name) it is from the Kafka message.unexpected_exceptions: indicates that there are non-retriable exceptions that can distinguish what message type (proto message name) it is from the Kafka message.
Metrics naming convention
The naming convention for metrics is as follows:
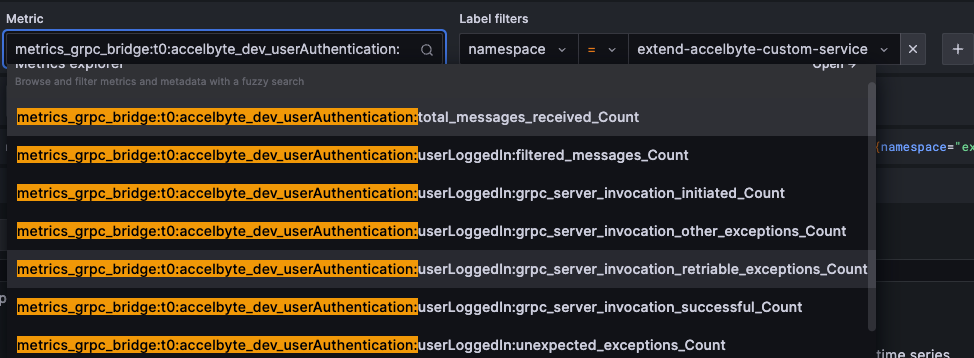
metrics_grpc_bridge:`<task_connector_id>`:`<topic>`:`<message_type_if_applicable>`:`<metric_name>`_Count
Example
In this example, with task connector instance ID 0 and topic accelbyte_dev_userAuthentication, the metrics are identified as follows:
- The first one is a top-level metric, belonging to
total_messages_receivedfor the topic. - The rest are metrics belonging to message type (proto message name):
userLoggedIn.