Use Grafana for observability
The Extend Override and Events Handler is currently available for Closed Beta partners only. Please submit a ticket if you're interested in applying as a Closed Beta partner.
Overview
You can use Grafana Cloud with AccelByte Gaming Services (AGS) to:
- Use Grafana's query editor that allows you to specify the exact logs, traces, and metrics data you want to retrieve. You can pick the data source for logs, traces, or metrics.
- Use Grafana's logging, traces, and metrics capabilities to enable effective debugging of the Extend Event Handler service.
Prerequisite
- The steps in this guide use the sample app described in Getting started with Event Handler as the practical example. Ensure that the sample app has been deployed.
Open the Grafana dashboard
To access your Grafana dashboard, follow these steps:
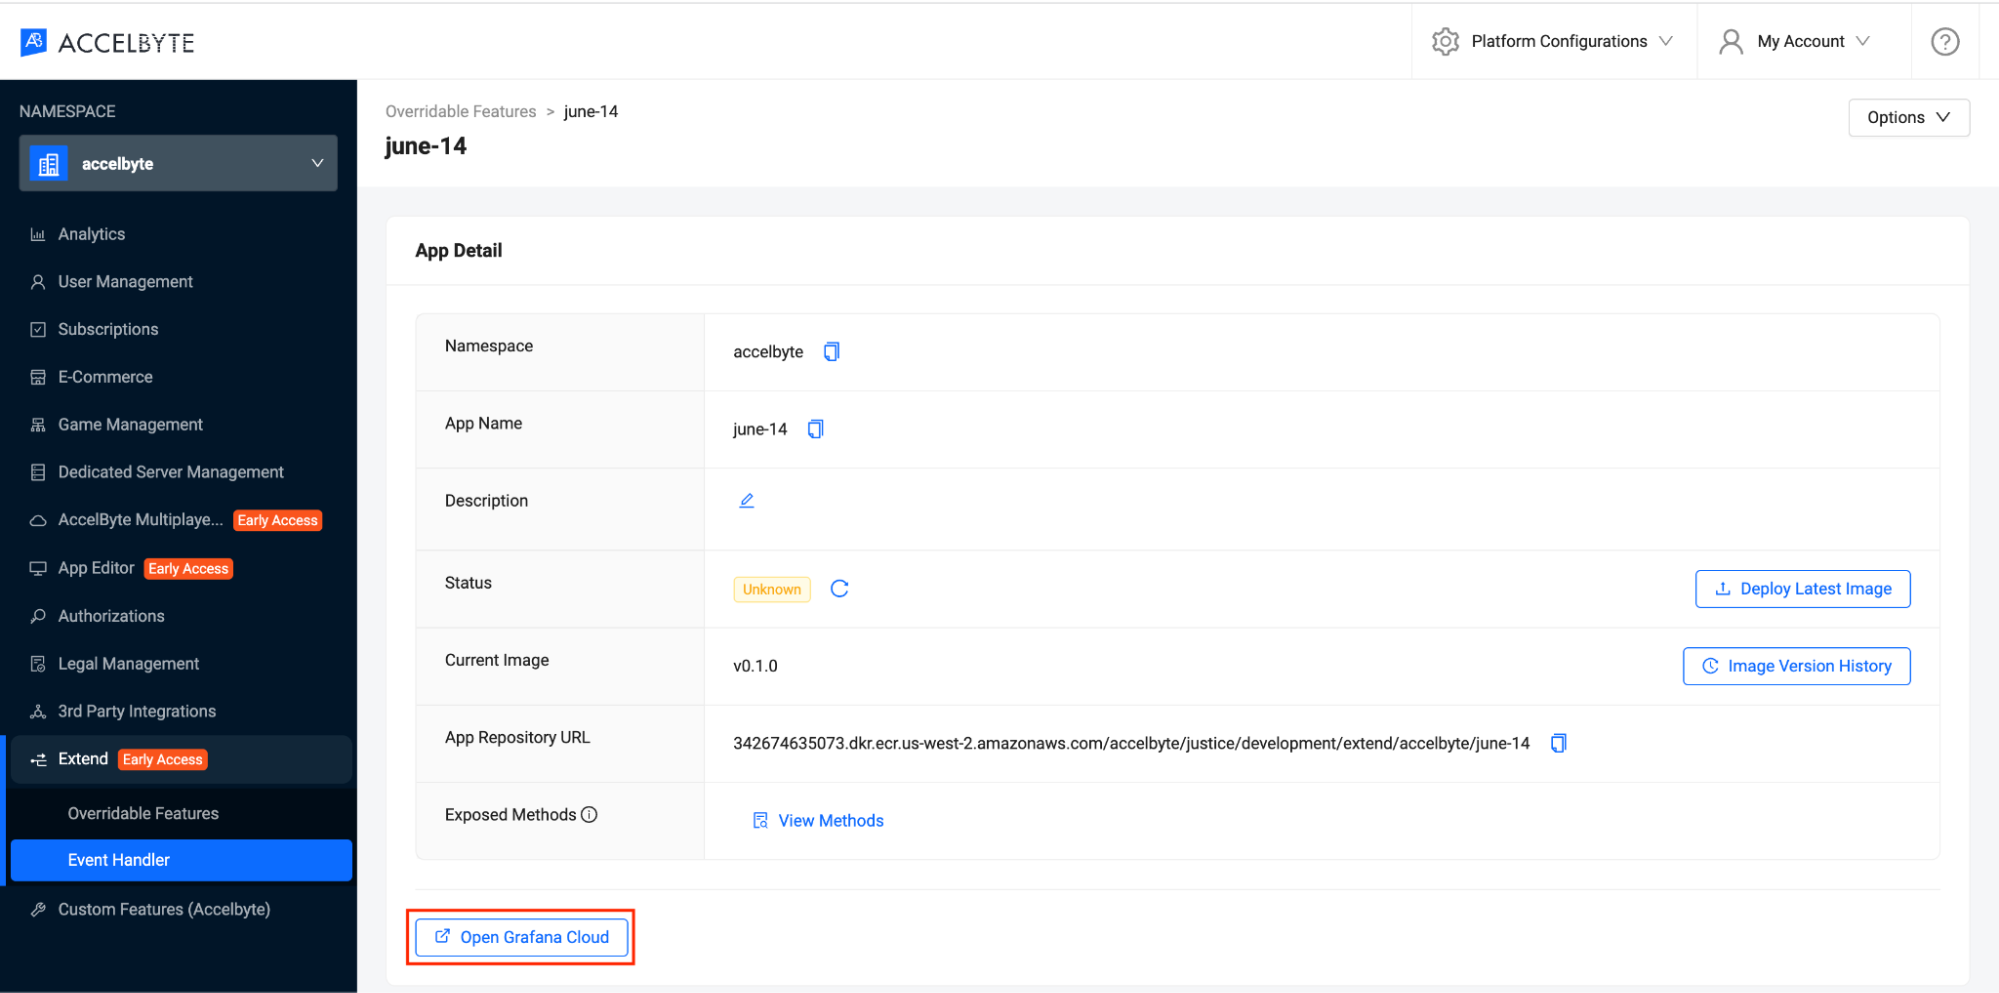
In the AGS Admin Portal, go to Extend, then select Event Handler.
On the Event Handler page, click the Open Grafana Cloud button. The link opens Grafana Cloud in a new browser tab.
You might be prompted to log in. Enter your credentials to proceed to the dashboard.
Dashboard overview
The dashboard has various tabs and panels. An important feature is the hamburger button (three horizontal lines) located in the top-left corner of the screen, which allows you to access the following important components:
Home: displays a quick overview of various dashboards and settings.
Dashboard: displays pre-configured panels containing data for logs, metrics, and traces. Accessible through the hamburger button.
Explore: allows you to manually query logs, metrics, and traces. To access this, click on the hamburger button and select Explore. In the Explore tab's Data Sources dropdown, you can select specific data sources, such as Loki for logs, Tempo for traces, and others for metrics. You can use these data sources for debugging purposes.
Working with logs
You can use Grafana's Loki feature to:
- Confirm the successful deployment and startup of the services.
- Confirm successful data transmission between these services.
The steps in this guide support two services:
- Kafka Connect: responsible for forwarding messages.
- Event Handler service: represented by the deployed sample app. This is the app mentioned in the Prerequisites section.
Navigate to logs
To view logs, click the hamburger button on the top-left corner to access the Explore tab.
Query logs
To execute a basic query log, follow these steps:
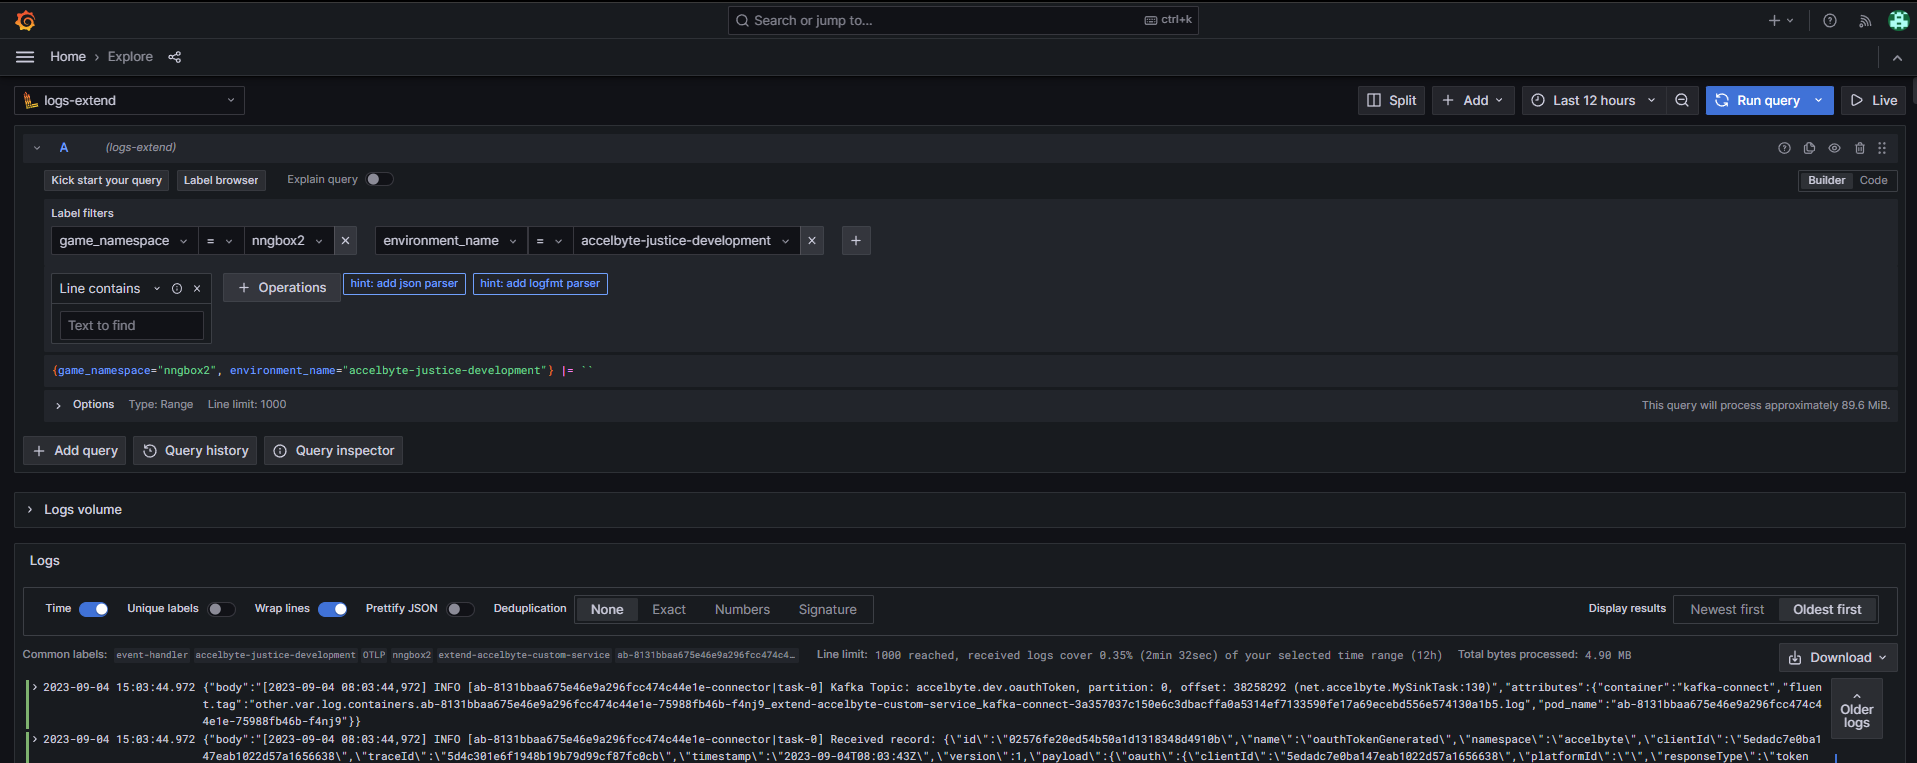
Select data source. Select the Data Sources dropdown, then choose the logs option. In this example, the logs option is logs-extend.
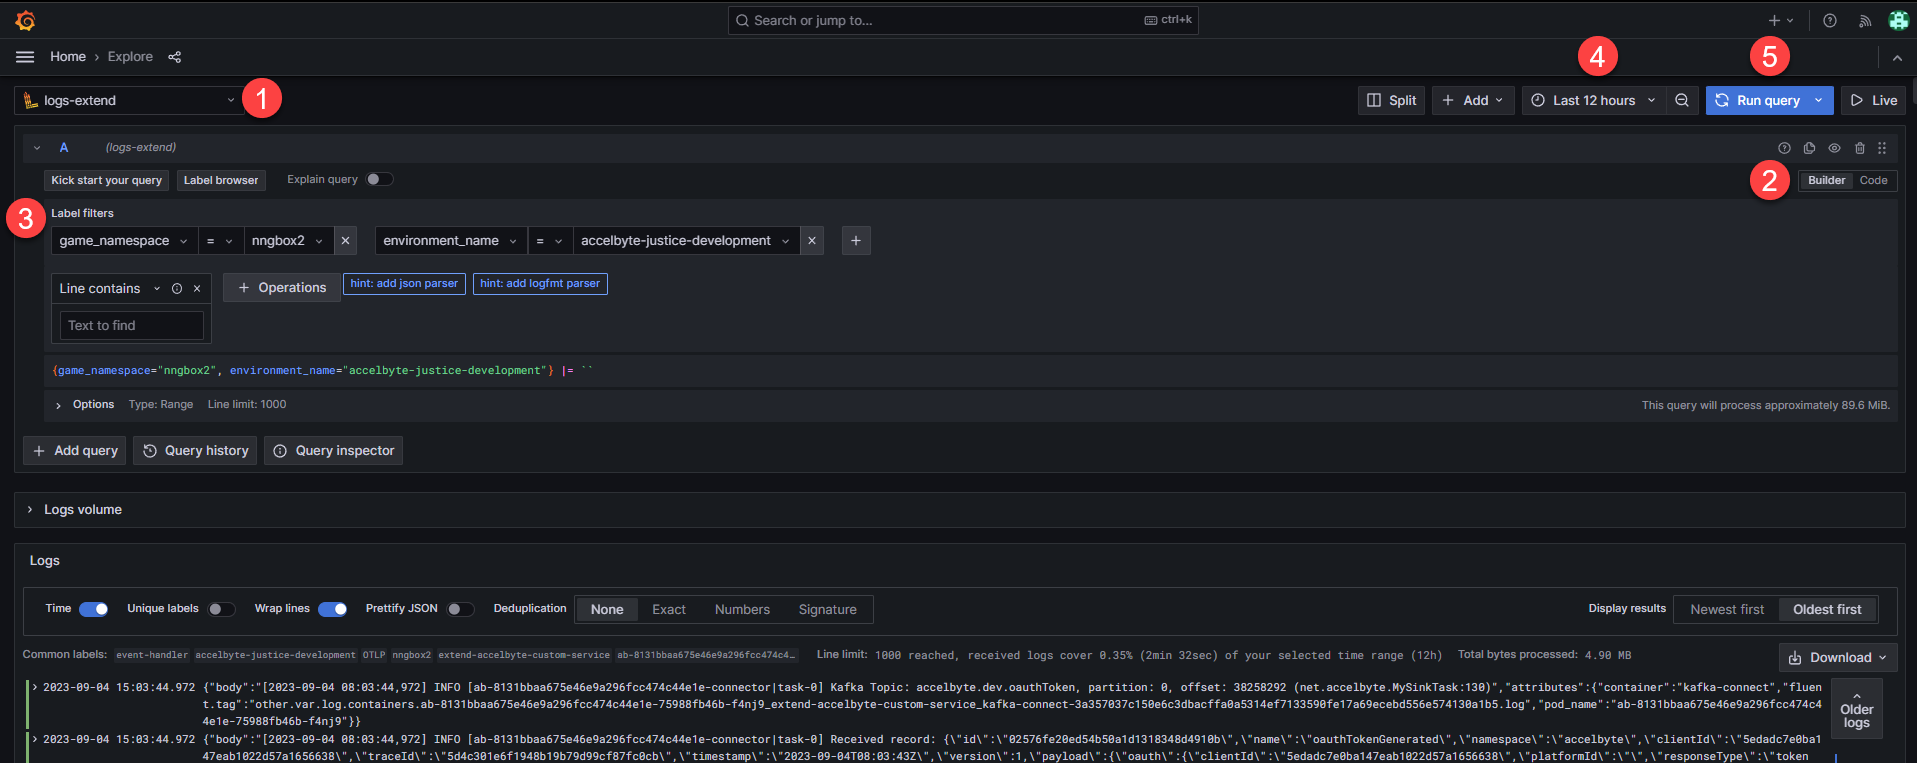 ヒント
ヒントFollow the number annotations in this image to locate the described actions in each step.
Set query type. Switch between Builder and Code to set the query type. Ensure that you select the type that supports your query.
Input the loq query. If you selected the Builder input, you can follow the example shown in the image in step 1. If you selected the Code input, use the following query and change the values for
game_namespaceandenvironment_nameaccordingly.{game_namespace="(your-namespace)", environment_name="(your-environment-name e.g. dev, prod, etc)"} |=Adjust the time range. Set the time frame of the query to the time frame you need.
Execute the query. Click Run query to display the logs that match your query.
Confirm successful deployment
This application comprises two services: Kafka Connect and the Event Handler service. Kafka Connect is deployed automatically and isn't accessible for direct debugging. The Event Handler service, however, is accessible and can be debugged directly. Familiarity with logs from both services is essential for effective troubleshooting.
To verify the successful startup of both Kafka Connect and the Event Handler Service, follow these steps:
Query for Kafka-Connect Startup Logs. In Code query input mode, run the following query. To narrow down the result, you can add more queries as needed. For example, you can set
environment_nameto query for a specific deployment environment.{game_namespace="(you-namespace)"} | logfmt | json | attributes_container="kafka-connect"This query filters logs from the application in your namespace, then processes them with
logfmtandjsonparsers, then finally looks for logs where theattributes_containeris marked askafka-connect. You'll see logs similar to the image below.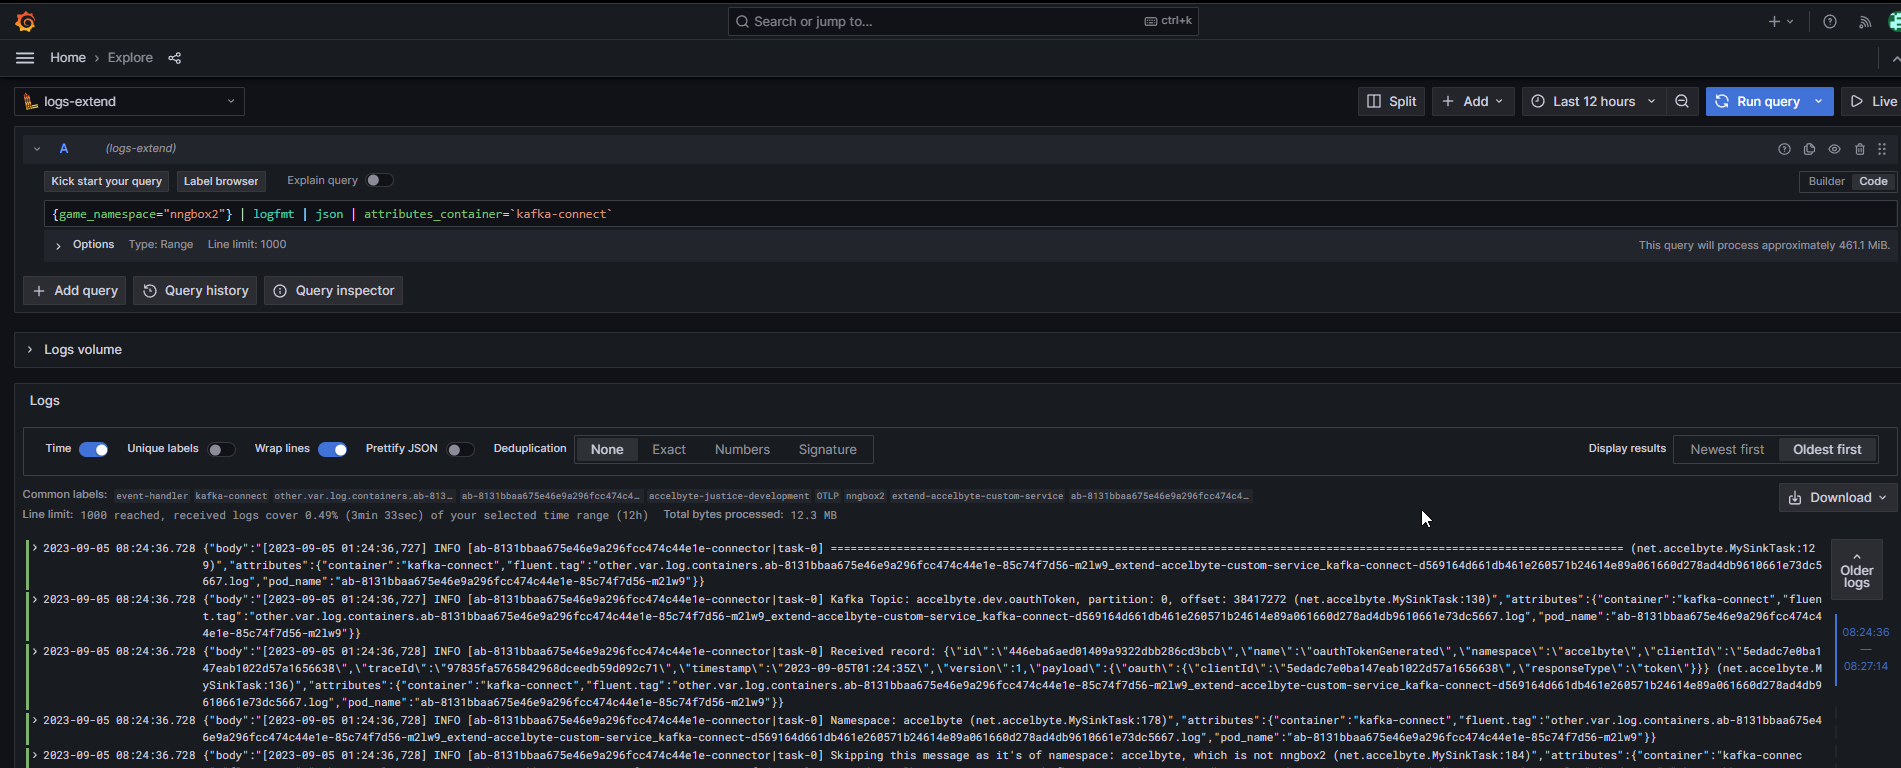 ヒント
ヒントMake the logs more readable by adding
line_formatto your query. For example:"<your query>" | line_format "{{.body}}".Query for Event Handler Service Startup Logs. In Code query input mode, run the following query. To narrow down the result, you can add more queries as needed. For example, you can set
environment_nameto query for a specific deployment environment.{game_namespace="(you-namespace)"} | logfmt | json | attributes_container="service"Similar to the Kafka-Connect query, this query filters logs for the Event Handler sample app, processes them, and looks for logs where the
attributes_containeris marked asservice.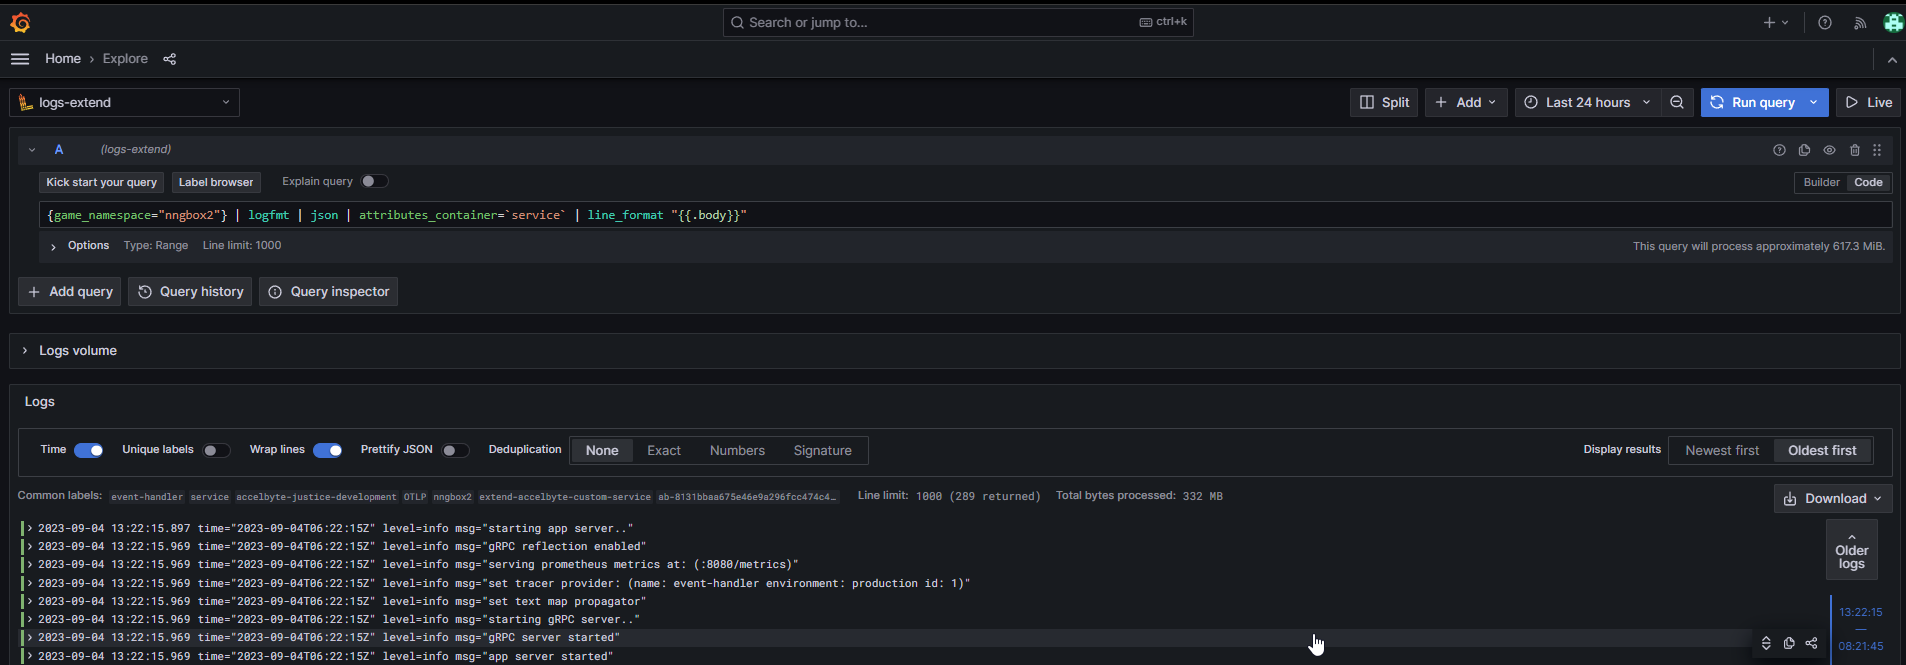 備考
備考The query in the image above uses
line_formatto make the logs more readable.
Confirm successful data transmission
Data should flow seamlessly between Kafka Connect and the Event Handler service for the application to function optimally. Recognizing the logs that confirm this successful data transmission is crucial.
To confirm that data is being successfully transmitted between Kafka Connect and the Event Handler service, follow these steps:
Trigger the transmission between Kafka-Connect and Event Handler service. Follow the steps in Getting started with Events Handler to trigger the test that produces the user logged in event.
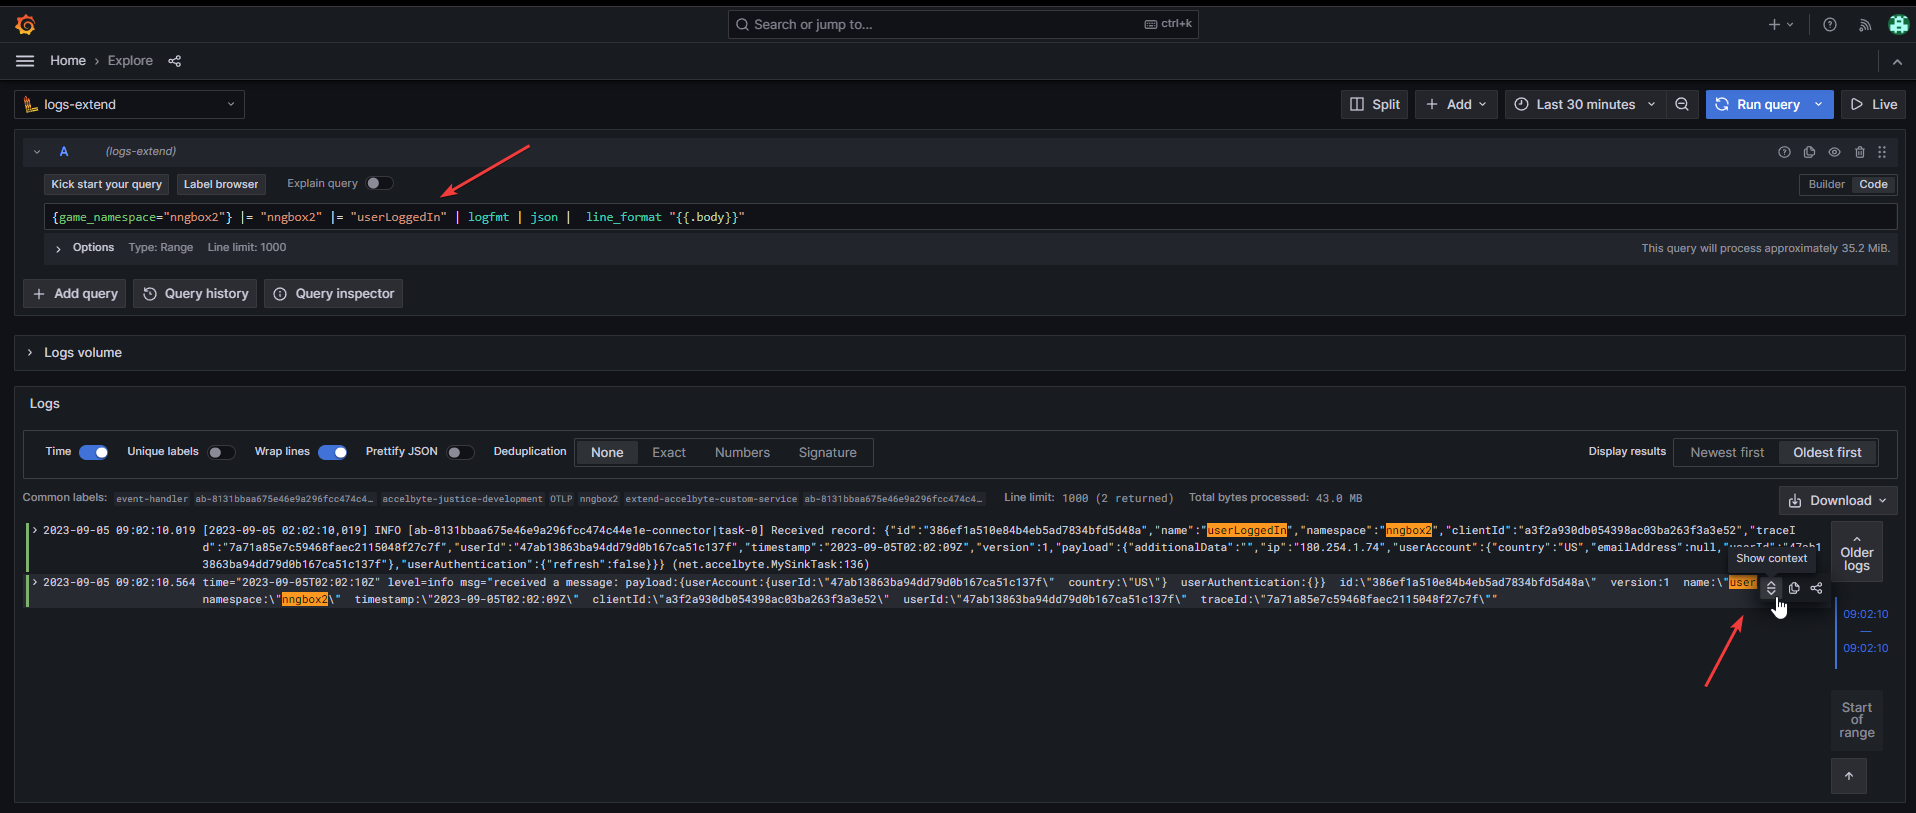
Query for Kafka-Connect Transmission Logs. In Code query input mode, run the following query. To narrow down the results, you can add more queries as needed. For example, you can set
environment_nameto query for a specific deployment environment.{game_namespace="(you-namespace)"} |= "(your-namespace)" |= "userLoggedIn" | logfmt | json | attributes_container="service" | line_format "{{.body}}"This query filters logs for the app and specifically looks for logs containing the phrases
"(your-namespace)"and"userLoggedIn". It then processes these logs throughlogfmtandjsonparsers, finally focusing on logs where theattributes_containeris marked askafka-connect. For more details, see the MessageuserLoggedInsection in IAM Client.If the query is a success, you'll see the output as shown below. To view the details of a log, click the Show context button.
Query for Event Handler Transmission Logs. In Code query input mode, run the following query. To narrow down the results, you can add more queries as needed. For example, you can set
environment_nameto query for a specific deployment environment.{game_namespace="(you-namespace)"} |= "(your-namespace)" |= "userLoggedIn" | logfmt | json | line_format "{{.body}}"This query filters logs for the app and specifically looks for logs containing the phrases
"(your-namespace)"and"userLoggedIn". It then processes these logs throughlogfmtandjsonparsers, finally focusing on logs where theattributes_containeris marked askafka-connect. For more details, see the MessageuserLoggedInsection in IAM Client.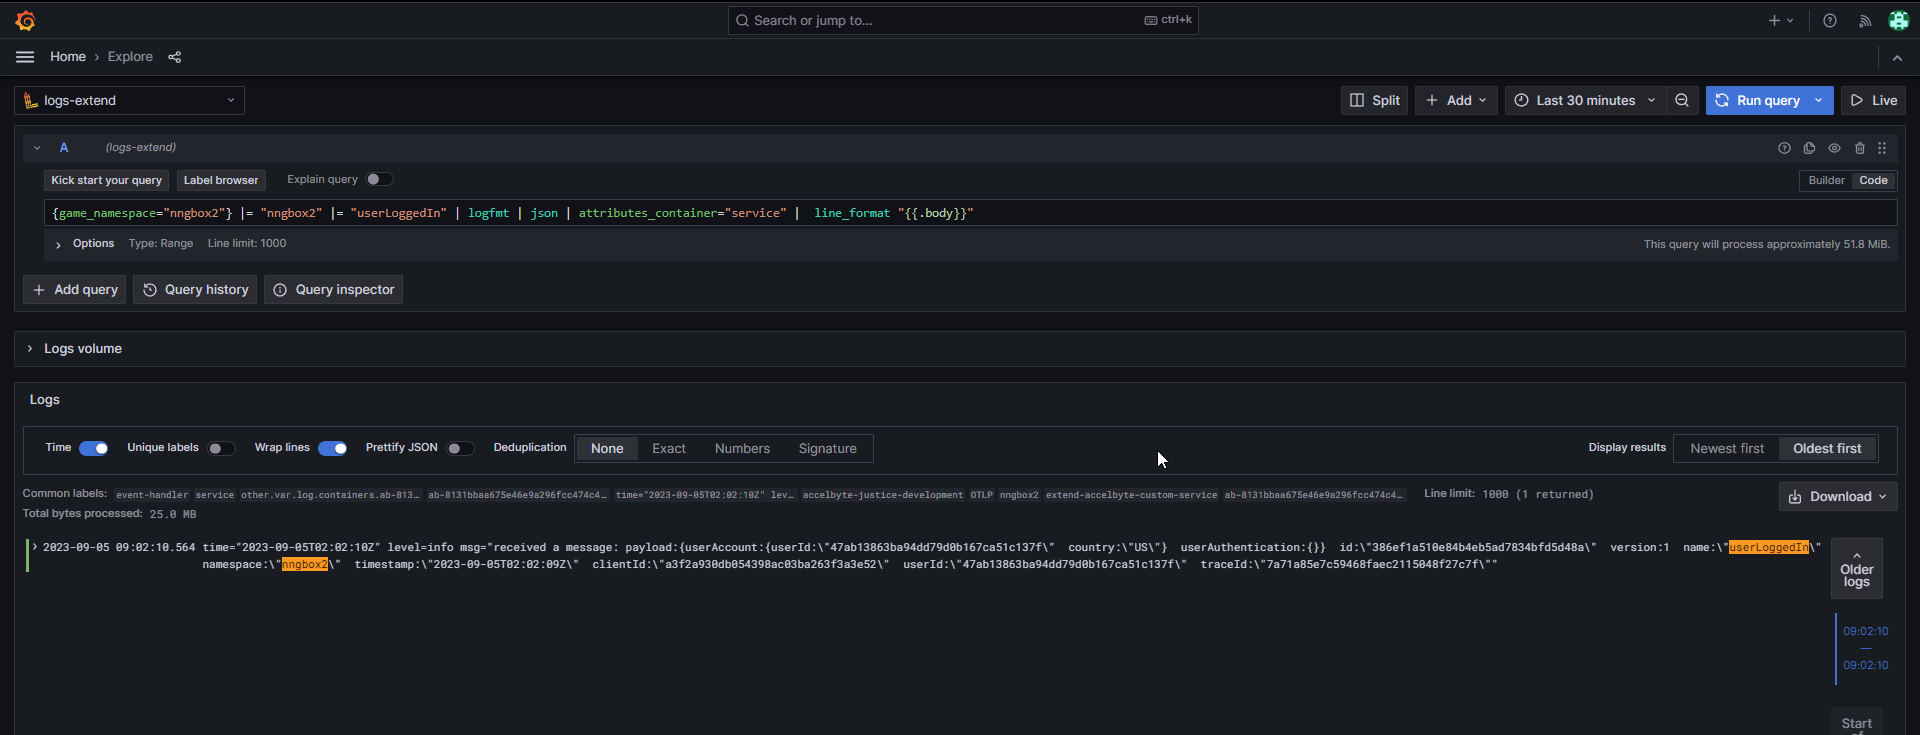
Monitor metrics in Grafana
Grafana's metrics provide quantitative data that helps you monitor the performance and health of both Kafka Connect and the Event Handler Service. Understanding how to navigate and interpret these metrics is crucial for ensuring optimal system performance.
Navigate to metrics
To view metrics, click the hamburger button on the top-left corner to access the Explore tab. Open the Data Sources dropdown, then select the metrics option. In this example, the metrics option is metrics-extend.
Query metrics
To query metrics in Grafana, follow these steps:
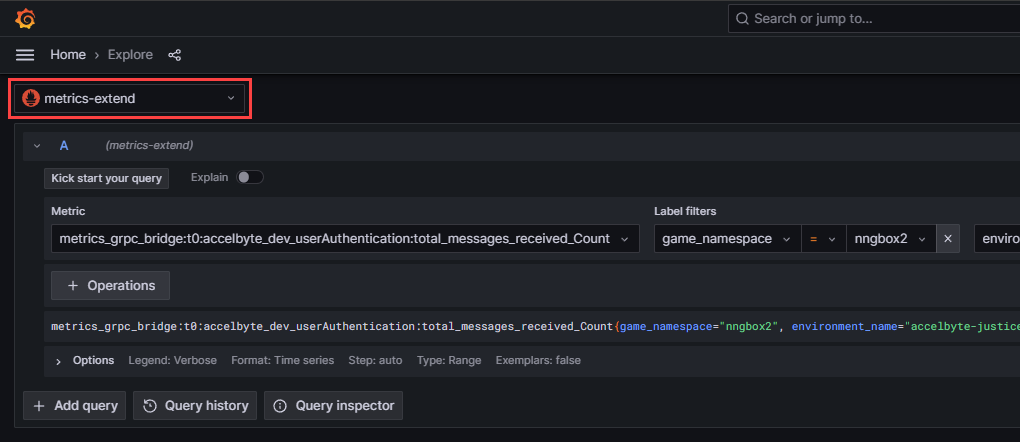
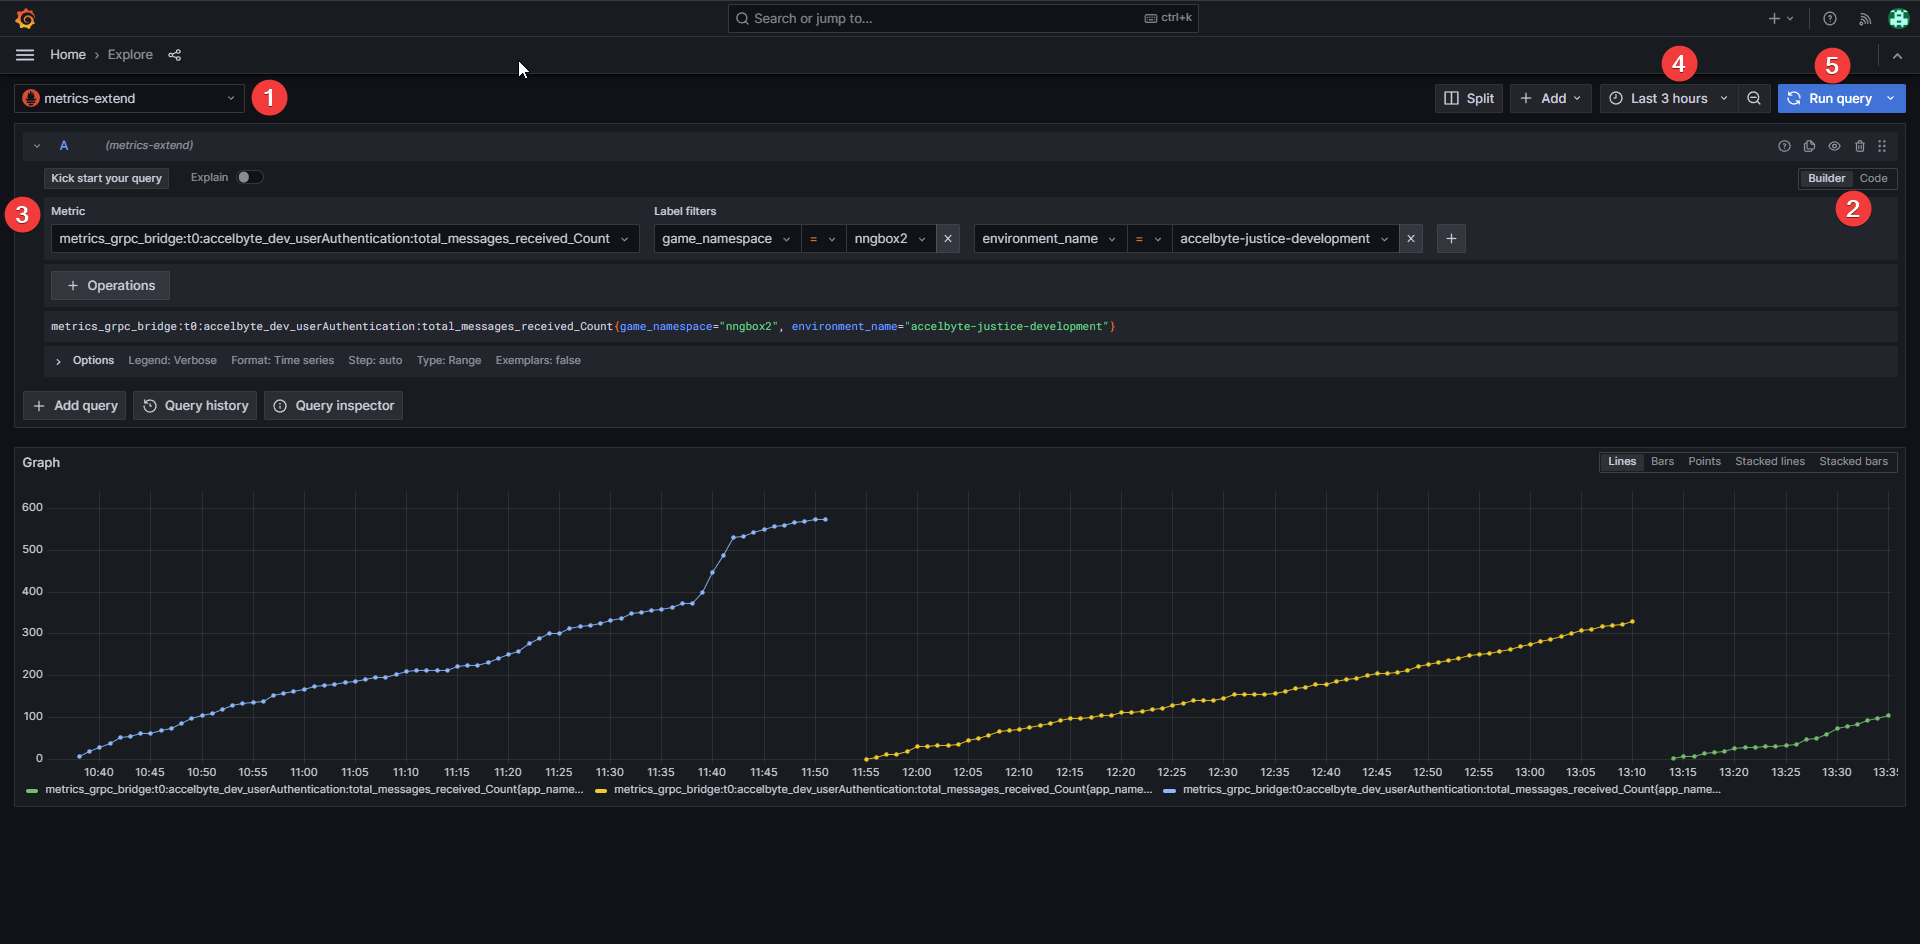
Select data source. Open the Data Sources dropdown, then select the metrics option. In this example, the metrics option is metrics-extend.
 ヒント
ヒントFollow the number annotations in this image to locate the described actions in each step.
Set query type. Switch between Builder and Code to set the query type. Ensure that you select the type that supports your query.
Input the loq query. If you selected the Builder input, you can follow the example shown in the image in step 1. If you selected the Code input, use the following query and change the values for
game_namespaceandenvironment_nameaccordingly.metrics_grpc_bridge:t0:accelbyte_dev_userAuthentication:total_messages_received_Count{game_namespace="(your-namespace)", environment_name="(your-environment-name e.g. dev, prod, etc)"}For more details about metric naming, see the Metrics naming convention section in Extend Handler - Metrics.
Adjust the time range. Set the time frame of the query to the time frame you need.
Execute the query. Click Run query to display the logs that match your query.
Confirm successful message processing
The metric grpc_server_invocation_successful_Count represents the total number of messages that have been processed successfully by both Kafka Connect and the Event Handler Service. This is a counter metric, which means that its value increments over time, and can be used to gauge the performance and reliability of the services' business logic. For more details, see Extend Handler - Metrics.
To ensure that messages are successfully processed by Kafka Connect and the Event Handler Service, you can monitor the grpc_server_invocation_successful_Count metric. Follow these steps:
Query for Kafka-Connect Success Metrics. Run the following query. This query is specifically designed to track this metric in Kafka Connect.
metrics_grpc_bridge:t0:accelbyte_dev_userAuthentication:userLoggedIn:grpc_server_invocation_successful_Count{game_namespace="your-namespace"}After running the query, you'll see results similar to the image below.
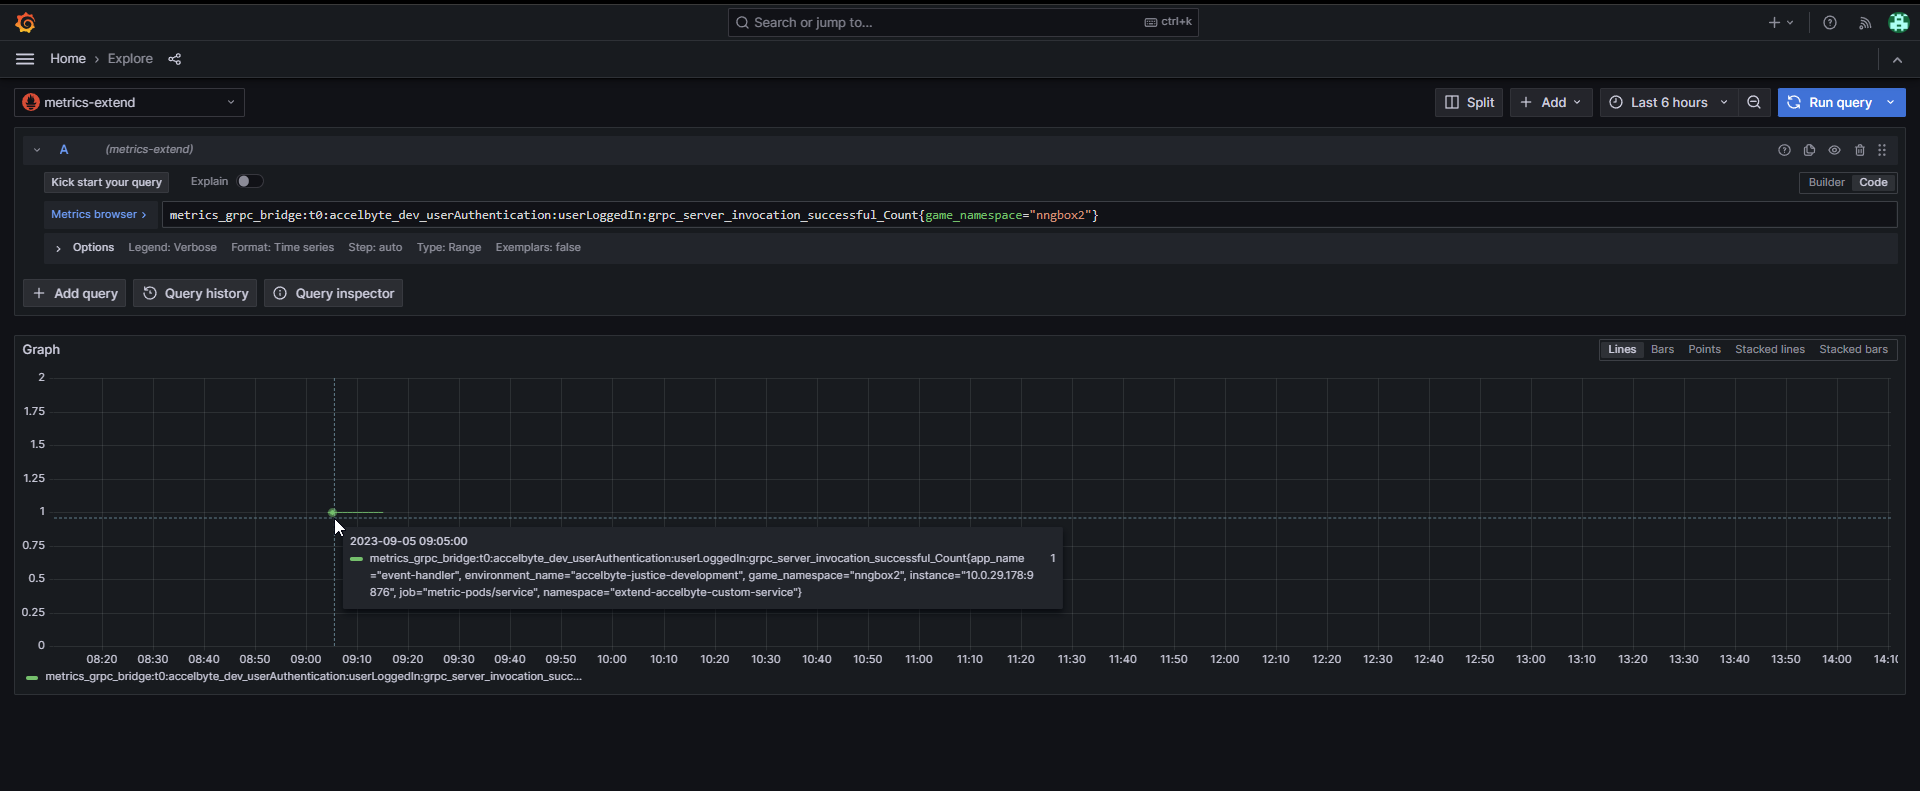
Expected Metrics for Kafka Connect. An incrementing metric count for
successfully_processed_messages_totalconfirms that messages are being successfully processed by Kafka Connect.