Service extension observability using Grafana
The Extend Override, Service Extension, and Events Handler are currently available for Closed Beta partners only. Please submit a ticket to apply as a Closed Beta partner if you're interested.
Introduction
You can use Grafana Cloud with AccelByte Gaming Services (AGS) to provide you with a query editor that allows you to specify the exact logs, traces, and metrics data you want to retrieve. You can pick the data source for logs, traces, or metrics by accessing the dropdown on the top.
This guide introduces Grafana Cloud tools for logs, traces, and metrics, utilizing the previously deployed sample app as a practical example. The objective is to offer familiarity with Grafana's logging, traces, and metrics capabilities to enable effective debugging of a service extension.
Access and navigate the Grafana dashboard
Begin by launching Grafana using the provided URL. Navigate to the designated dashboard for the sample app.
For another relevant topic on opening the Grafana dashboard, please refer to the Extend observability introduction page.
Use the visual guide
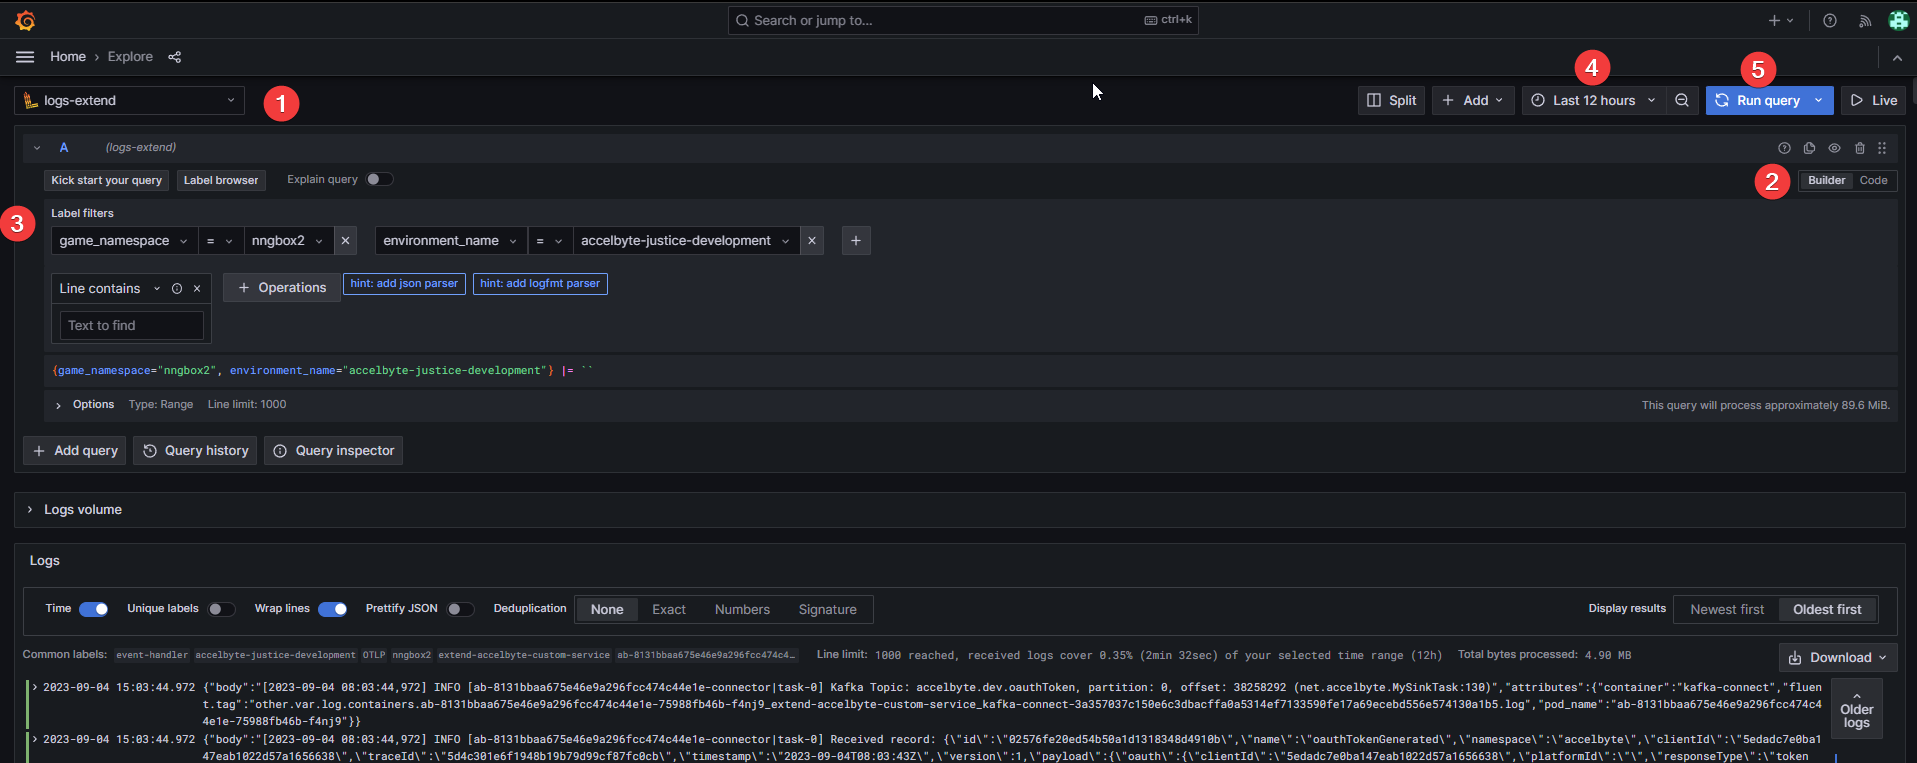
- Data Source: Refer to marker #1. Use the dropdown to select "logs".
- Query Method: At marker #2, opt for either the
Query BuilderorCode input. - Set Log Query: See marker #3. For code input, adjust and paste the sample query; if you're using the builder, follow the screenshot's example.
- Define Time Range: Use marker #4 to set your desired time frame.
- Execute & Review: Hit the Run Query button at marker #5 to view the logs.
Filter and identify startup logs
The initial moments after deploying an application are critical. It's during these moments that the application initializes and sets the stage for its operation. By examining the logs generated during this startup phase, developers can ensure the app has successfully transitioned from deployment to a running state.
Using the visual guide above, complete the steps below to apply filters and identify logs.
Initiate the search: Refer to marker #3, the search bar, as your starting point for this verification process.
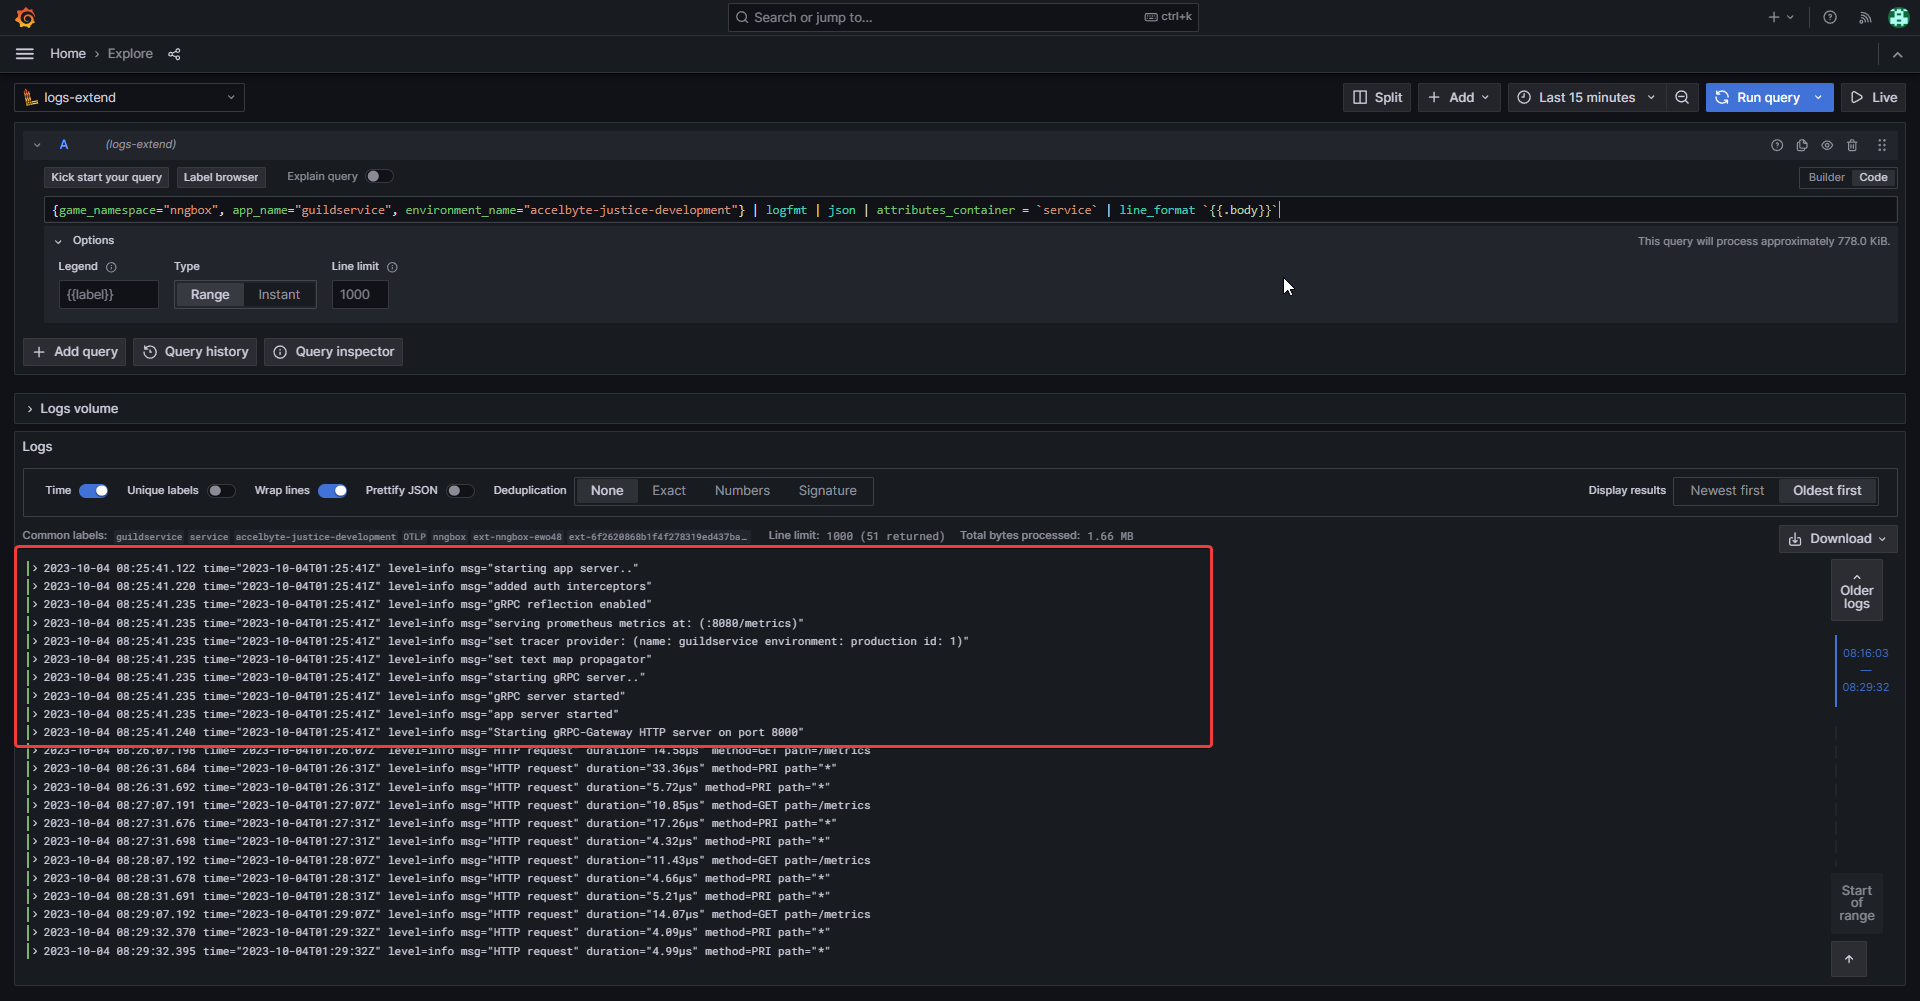
Apply the filter: If you're using
Code inputas the Query Method (refer to marker #2), you can put the following query:{game_namespace="(your-namespace)", app_name="(your-appname)", environment_name="(your-enrionment)"} | logfmt | json | attributes_container = `service` | line_format `{{.body}}`TipTo make the logs more readable, you can add
line_formatto your query, e.g.,"<your query>" | logfmt | json | line_format "{{.body}}".Execute the search: Click on the "Run Query" button, highlighted by marker #5, to surface the relevant logs.
Review the outcome: If the app is running properly, you will see something like the following screenshot:
Identify logs for successful endpoint calls
When an endpoint is successfully called or invoked, it means the application is not just running, but is actively processing requests and serving its intended functions. By observing the logs related to endpoint calls, developers can validate the application's responsiveness and functional health post-deployment.
Using the visual guide above, complete the steps below to identify logs for successful endpoint calls.
Initiate the search: Refer to marker #3, the search bar, as your starting point for this verification process.
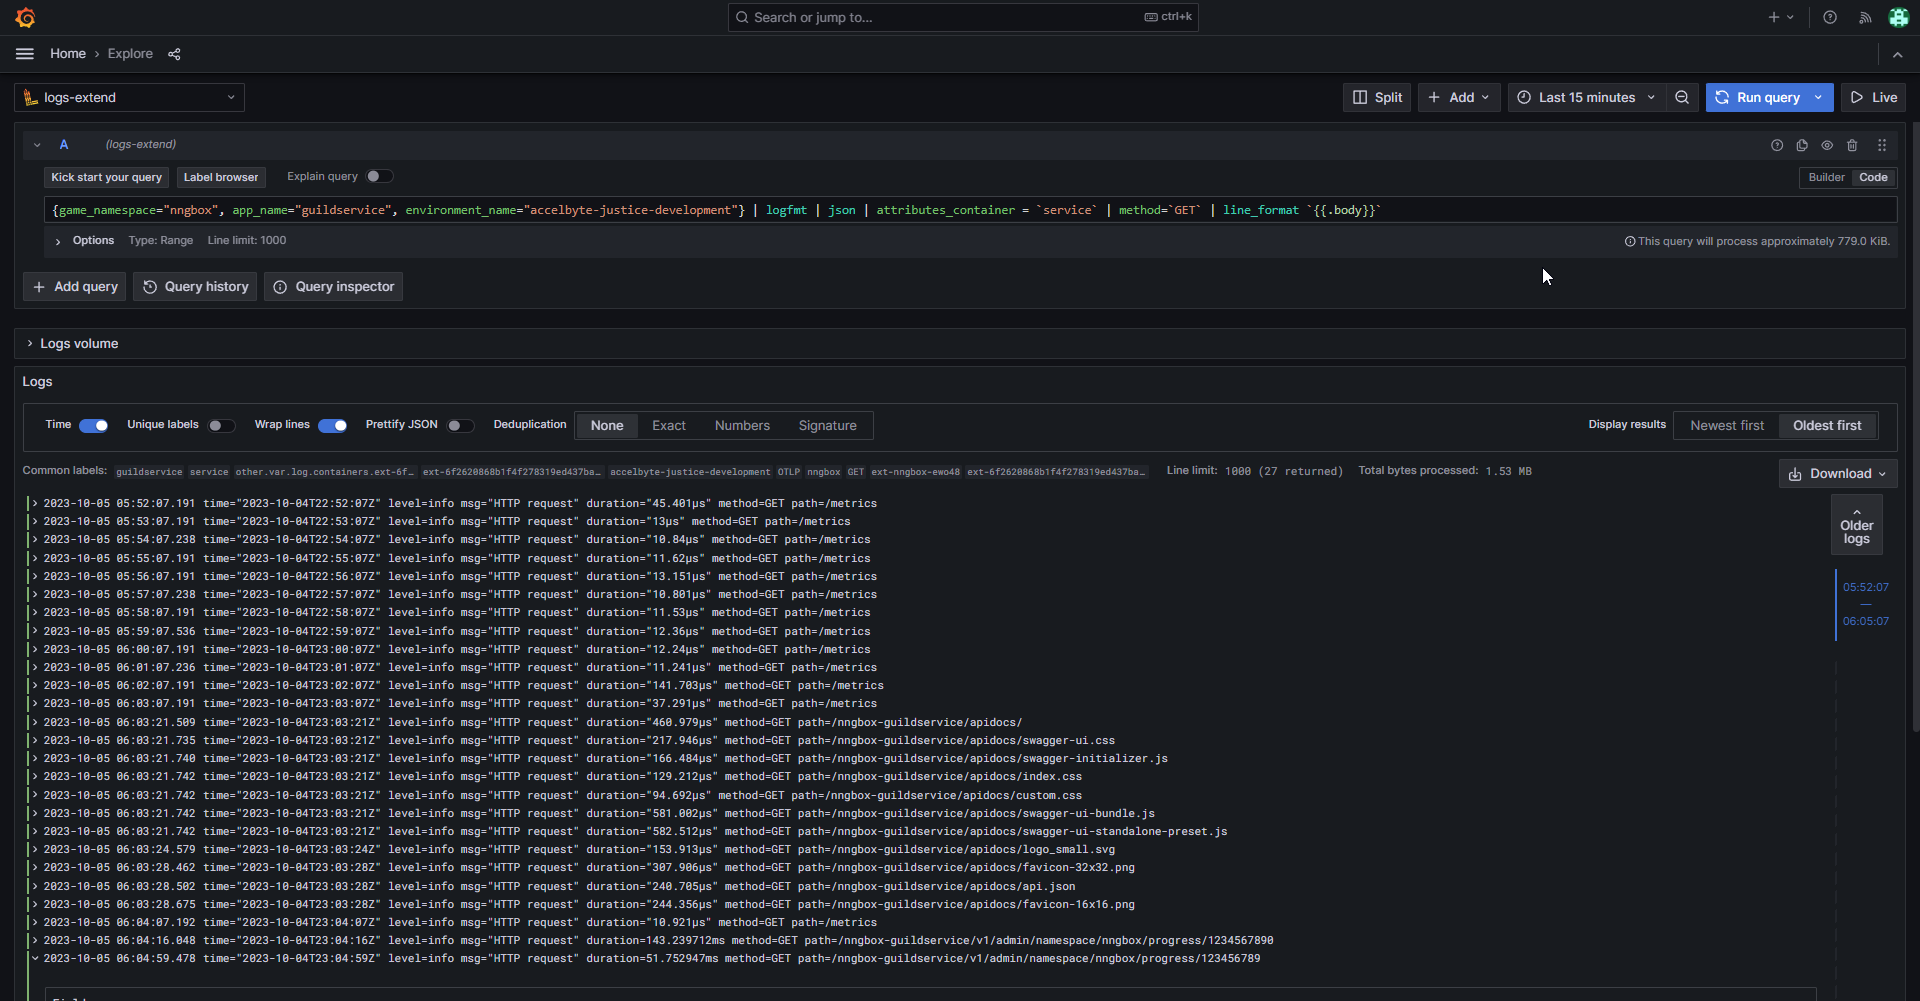
Filter for endpoint calls: If you're using the
Code inputas the Query Method (refer to marker #2), you can put the following query:{game_namespace="(your-namespace)", app_name="(your-appname)", environment_name="(your-enrionment)"} | logfmt | json | attributes_container = `service` | method = `GET` | line_format `{{.body}}`TipsIn this sample, we're using
method = `GET`, but you can usemethod =~ `.*`to filter all kinds of HTTP requests.Run the query: Click on the Run Query button, highlighted by marker #5, to surface the relevant logs.
Examine the results: If the app is running properly, you will see something like the following screenshot:
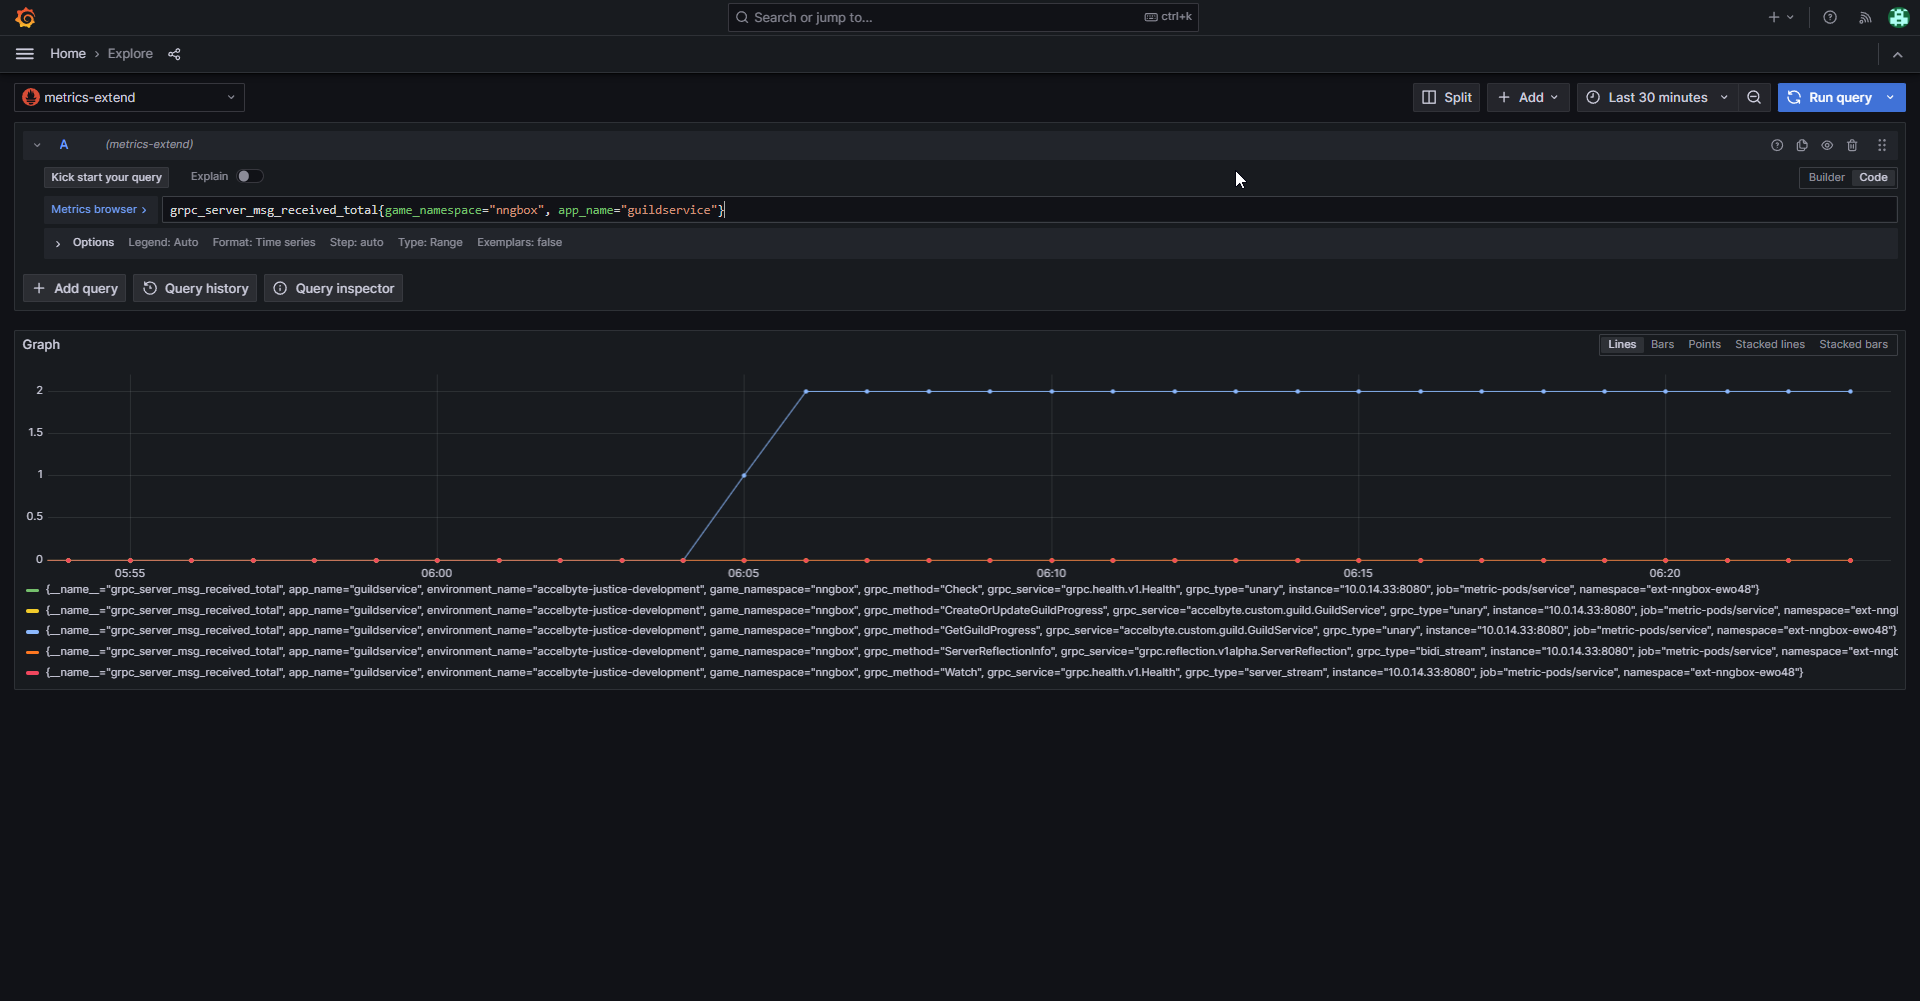
Observe gRPC message reception metrics
Observing the reception of gRPC messages allows you to gauge the server's activity. We will use grpc_server_msg_received_total, which is a built-in metric provided by the sample app that counts the total number of gRPC stream messages received by the server. It gives insights into the server's message processing load, allowing you to identify traffic patterns and potential spikes in activity.
Monitor grpc_server_msg_received_total in Grafana
Using the visual guide above, complete the steps below to monitor grpc_server_msg_received_total in Grafana.
Switch the data source: Navigate back to marker #1 and select "metric" as the data source.
Metric query input: On marker #3, you can put this into the metric query bar if you're using
Code Inputas the Query Method:grpc_server_msg_received_total{game_namespace="(your-namespace)", app_name="(your-appname)"}Execute and analyze the metric: Click the Run Query button, identified by marker #5 and you'll see something like this: